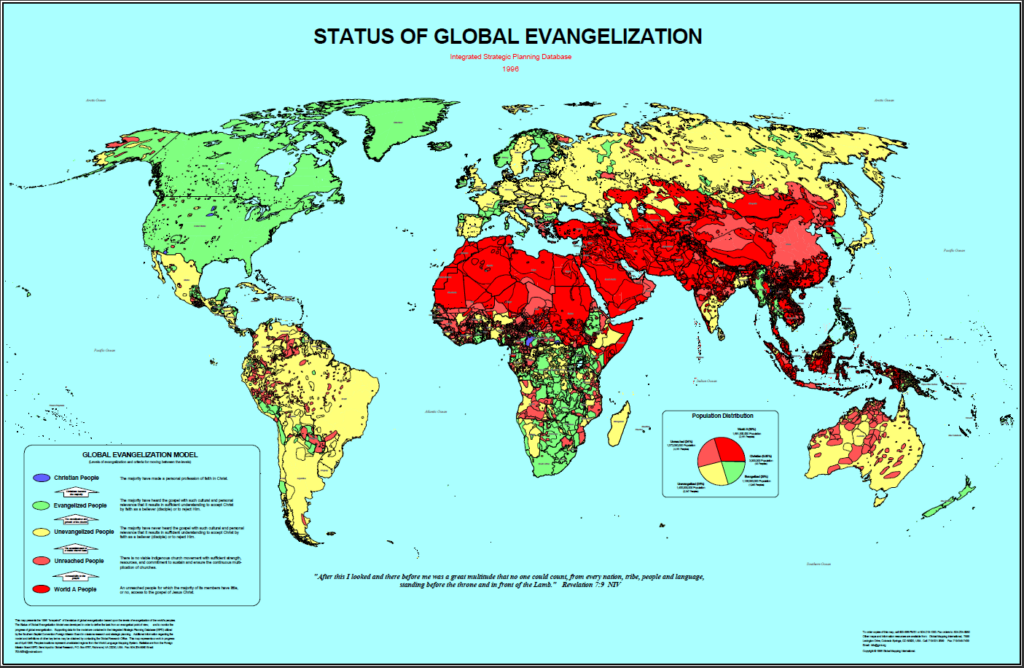
In 1996 an organization Global Mapping International worked with the International Mission Board, who provided the statistical data, and some other sponsoring organizations to create a wall map showing the Status of Global Evangelization of people groups of the world. On the original map logos of the sponsoring organizations were shown at the bottom of the map but these are not on the map pictured with this article. Status of Evangelization means the percent of believers among people groups. This data had never been mapped at a global level previously. The geographic polygons used to represent the people groups were from the World Language Mapping System. For more information about this system see the Dec. 19, 2023 webinar, Mapping the World’s Languages by Matt Benjamin or this 2006 article in ArcNews, www.esri.com/news/arcnews/spring06articles/pinpointing.html.
Using red to represent the groups least exposed to the gospel, the map showed there are many groups who had never heard the gospel. Some people who saw the map let us know where they thought the data was incorrect. This is an advantage/disadvantage of a map being able to graphically show data. Data error become more visible. There were cases of the same people group in adjoining countries was shown with two different statuses. Most of these would be data errors. We found by making the map large, it attracted more attention and emphasized the story behind the data. The map was used to remind us of the spiritual need in the world.
The map caused some controversy due to three reasons. A number of people, especially Europeans felt the map didn’t show the severe spiritual need of Europe. Most people who consider themselves as Christian in that area are nominal or only in heritage. Most don’t actually practice faith in Jesus and don’t have a personal relationship with him. A second reason was that some large areas shown in dark red as World A are uninhabited (e.g. the Sahara Desert area, a lot of Saudi Arabia). That is one reason many newer maps showing the Status of Evangelism use points rather than polygons.
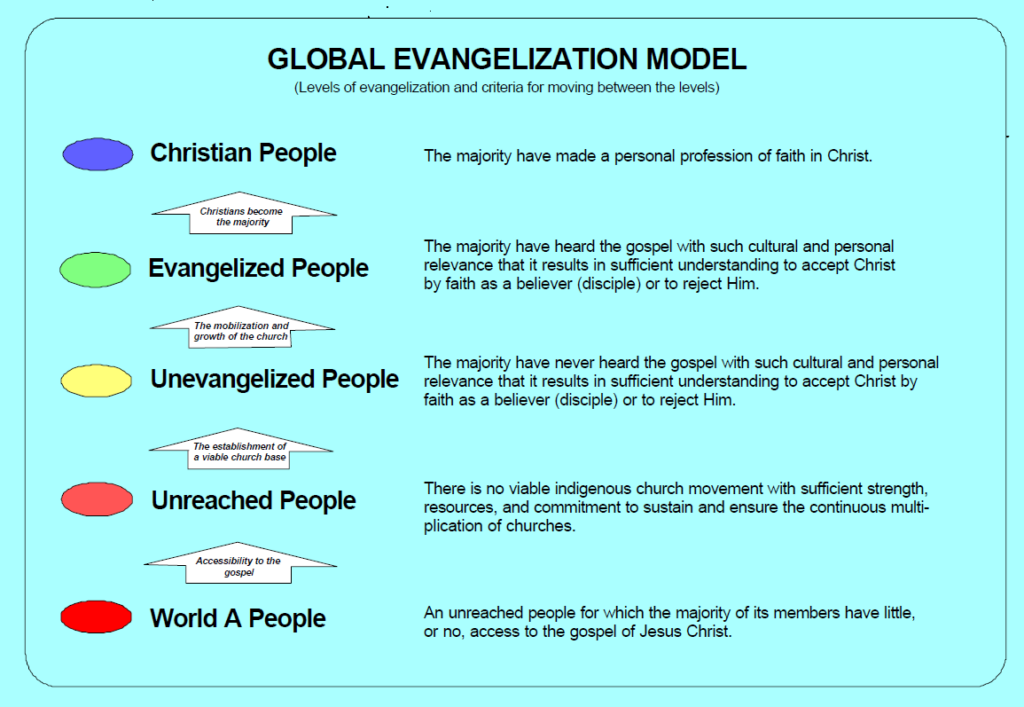
A third concern was so few people groups were displayed as Christian. If you look at the legend which is shown to the right, this was due to a very restrictive definition of the category, “The majority have made a personal profession of faith in Christ.”
Thus though there were differing opinions about the map, it is a good example of the power of displaying data on a map as contrasted with seeing data in numeric form.
Mapping, people group mapping, and data have progressed over the 27 years since the map was made. The International Mission Board and Joshua Project have made newer maps showing the progress of the Good News with people groups, www.imb.org/research/maps/, www.joshuaproject.net/resources/maps. The International Mission Board also has created an open data set of people group polygons and points which can be used in GIS systems. Click on People Groups link at https://go-imb.opendata.arcgis.com/. Statistical data is included with this dataset.